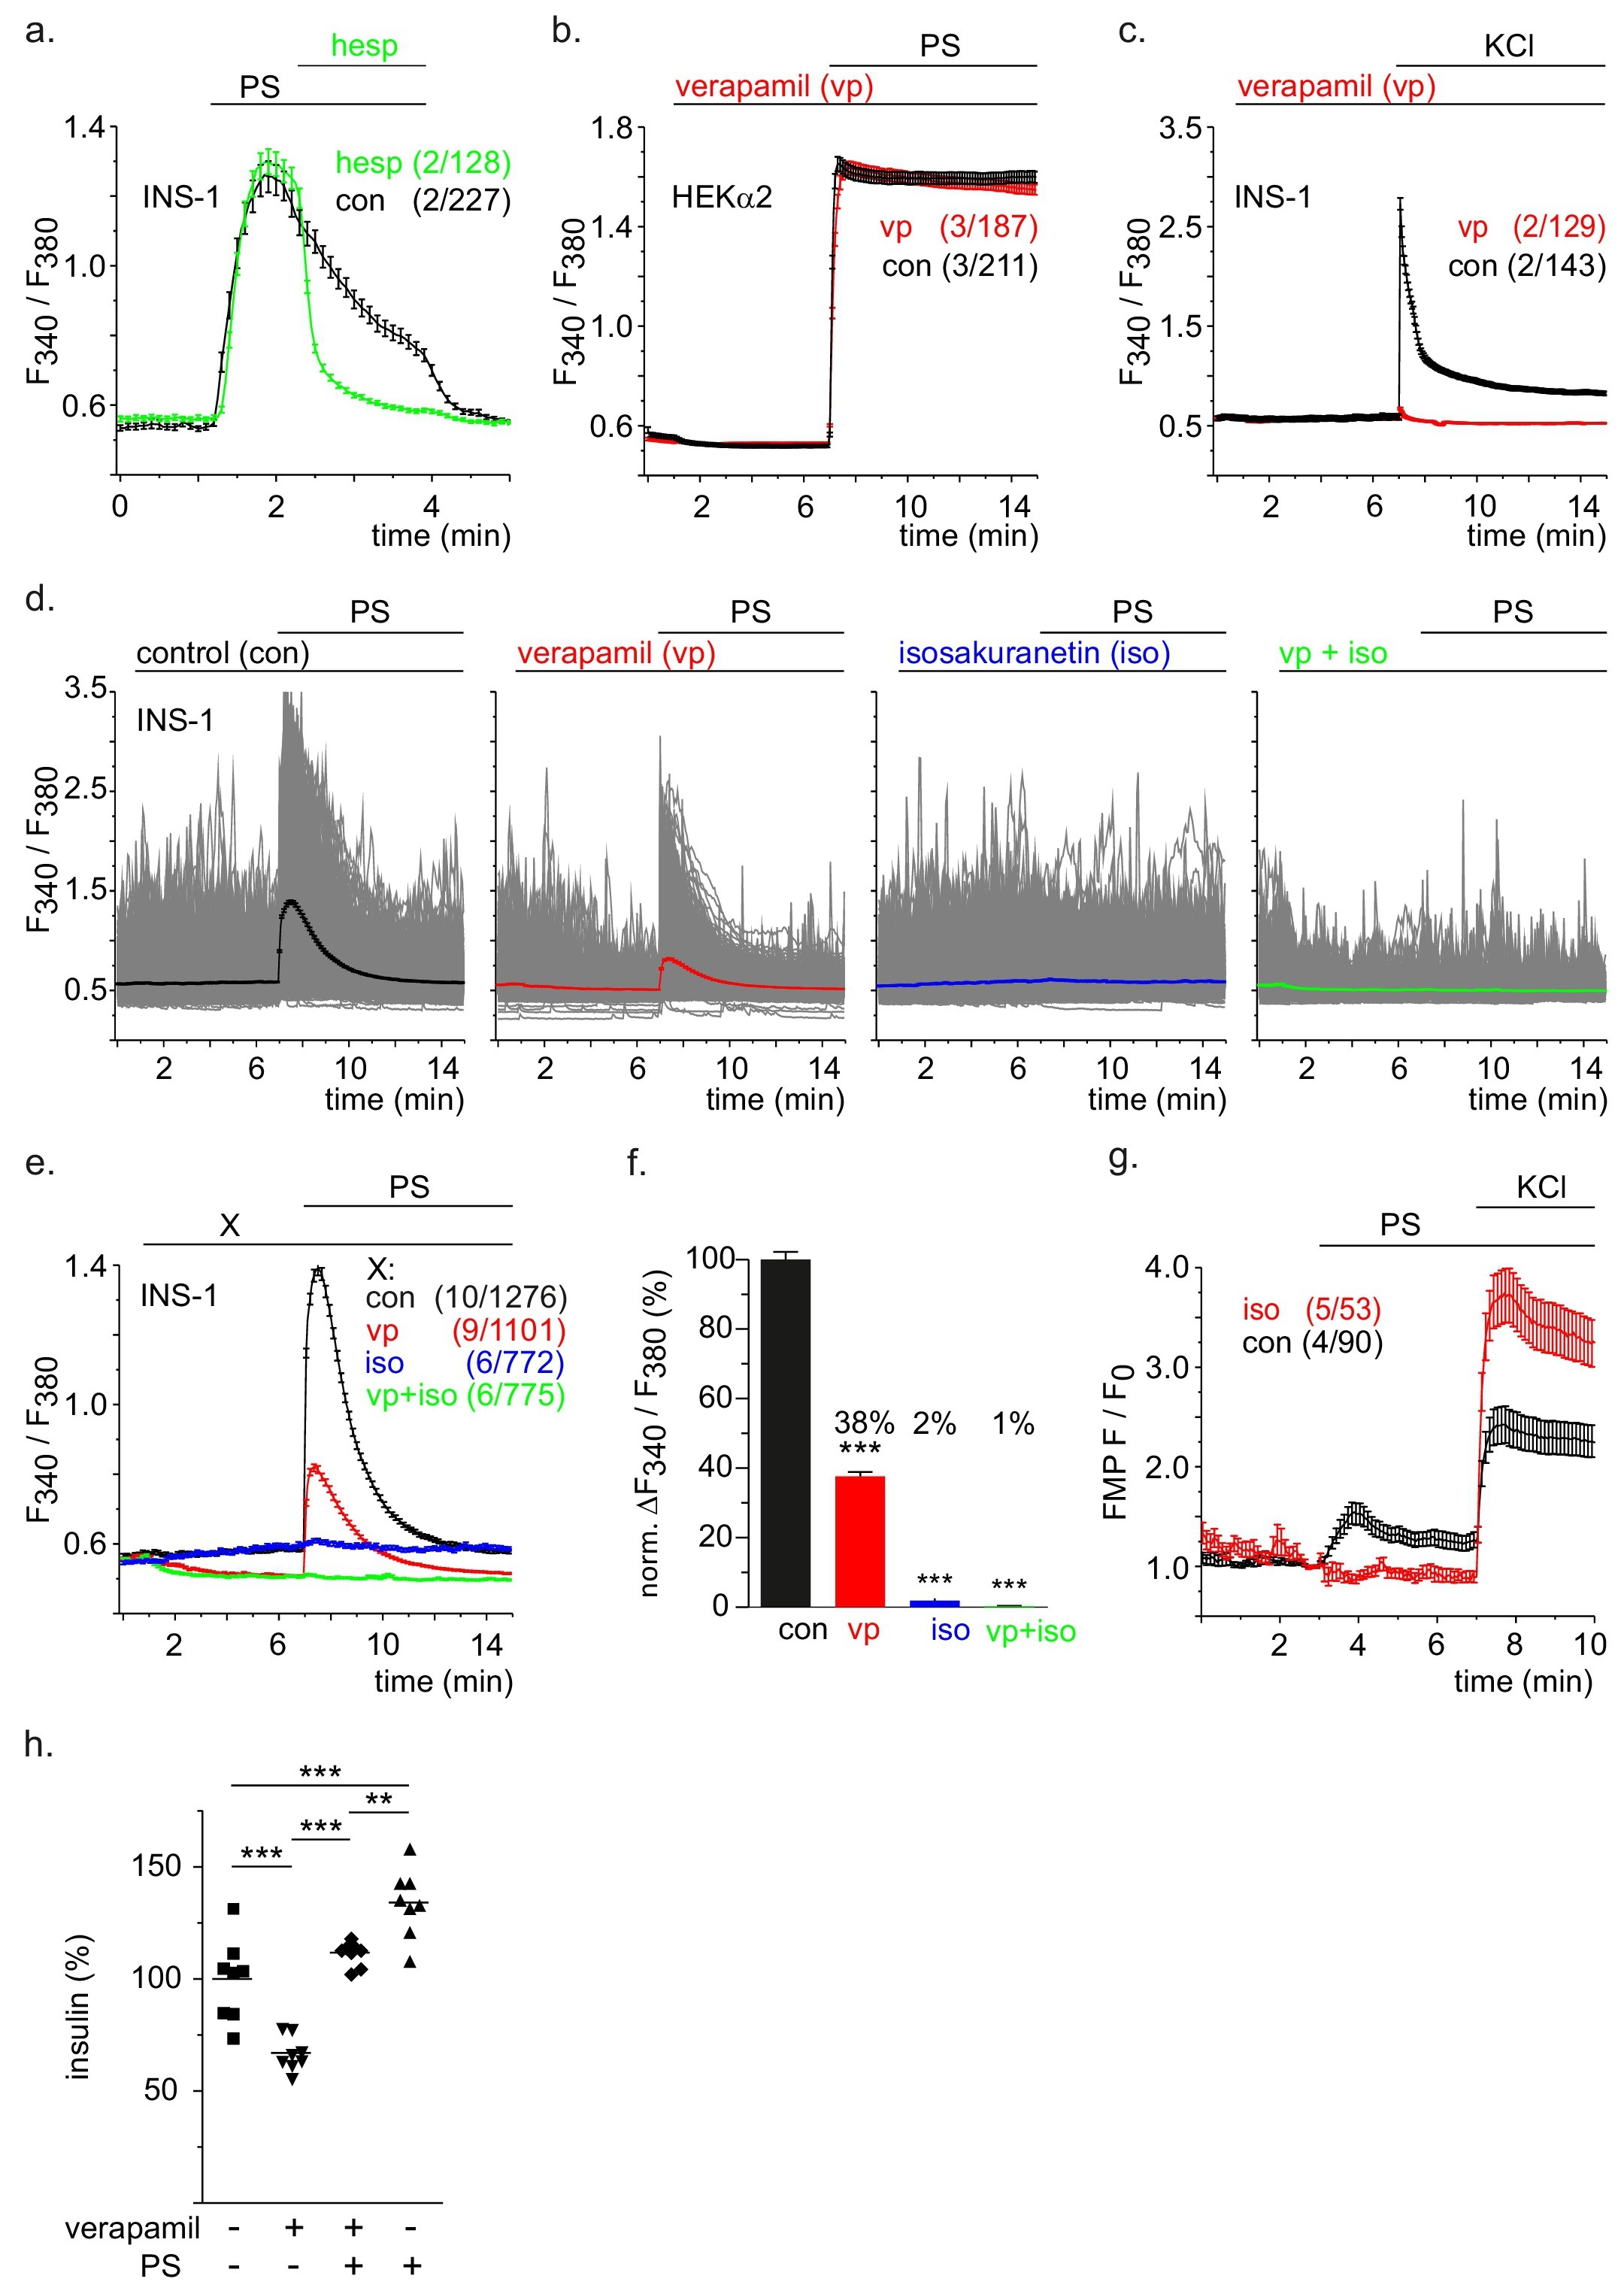
Fig. 2. TRPM3 triggers CaV activity and both channels together contribute to PS-induced insulin release. (a-f) Fura-2 fluorescence ratios measured in INS-1 cells (a, c-f) or TRPM3α2-overexpressing HEK293 cells (HEKα2, b) before and after addition of 100 µM PS or 25 mM potassium chloride (KCl) in the absence or presence of 50 µM hesperetin (hesp), 50 µM verapamil (vp), 10 µM isosakuranetin (iso) or solvent only (con) as indicated. Thick traces represent mean values (± SEM) with the numbers of experiments/cells indicated in brackets. (d) Measurements of single cells are shown in grey. (e) Summary of the experiments shown in (d). (f) Maximal increase of [Ca2+]cyt shown in (e) before and after the addition of PS. Values were normalized to the mean of the control value and are indicated above the bars. (g) Fluorescence changes in INS-1 cells of the voltage-sensitive FLIPR dye FMP in INS-1 cells upon application of 100 µM PS or 36,4 mM KCl as control in the absence (con) and presence of 10 µM isosakuranetin (iso). Results are given as mean F/F0 ± S.E.M. with F0 = mean of F160 to 180 s with the numbers of experiments/cells indicated in brackets. (h) Insulin released from INS-1 cells in the absence (-) or presence (+) of 100 µM PS and/or 50 µM verapamil. Values were normalized to the mean level obtained in the absence of both compounds.